3D input data for noise studies version (0.3 February 2020) [Nederlandse versie]
- What is 3D noise in the Netherlands? An introduction
- Description test data version 0.3
- Downloads
- Feedback Form
What is 3D noise in the Netherlands? An introduction
The past 3 years, we have investigated to automatically reconstruct 3D noise data in a collaboration of Rijkswaterstaat, RIVM, Kadaster and the 3D geoinformation research group from TU Delft. In this collaboration, we have investigated how 3D data on noise sources and the environment, as required in legally prescribed noise studies, can be automatically generated for the whole of the Netherlands from existing data such as the Key Register Addresses and Buildings (BAG), the Basic Register for Large-Scale Topography (BGT) and the airborne LiDAR point cloud covering the whole of The Netherlands (AHN).
This is an ongoing project that was started in 2017. A more detailed project description can be found here.
On this site we publish an example dataset that is generated using the 0.3 version of our method in January 2020. With this sample dataset interested parties have the possibility to review our results and send us feedback. At this moment we are further developing our methods to version 1.0. Results will be available beginning of 2021.
Description test data version 0.3
Our method aims to achieve high detail and accuracy, while keeping the resulting files small and adhering to the requirements and limitations of the currently available noise simulation software on the market.
With version 0.3 we deliver three input layers for 3D noise studies, namely
- building models (gebouwen),
- ground types with noise reflection/absorption factors (bodemvlakken), and
- terrain (TIN).
These three input layers were generated fully automatically from the public BAG, BGT and AHN3 datasets and are explained in more detail below. We also investigated noise barriers (geluidsschermen) and bridges (bruggen), however these are not part of the v0.3 example dataset.
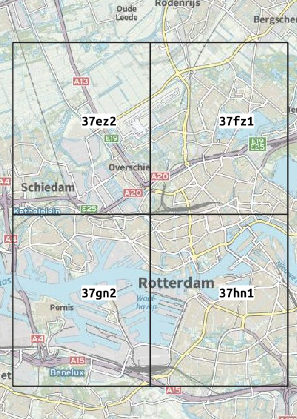
The study area of the sample dataset spans the 37ez2, 37fz1, 37gn2, and 37hn1 AHN tiles nearby the city of Rotterdam as illustrated below. We provide this test data in order to collect feedback that we will use for future developments where we plan to upscale the results to the whole of the Netherlands. For version 0.3 we have made initial choices regarding the simplification of the data, height-differences between connecting building parts, minimimum sizes of details etc. Based on the feedback we can adjust these parameters in a next release.
The input data can directly be used as input in software that implements the Standaard Rekenmethode II van het RMG2012 (SRM2) (i.e. the Dutch legally prescribed calculation method), like GeoMilieu and WinHavik.
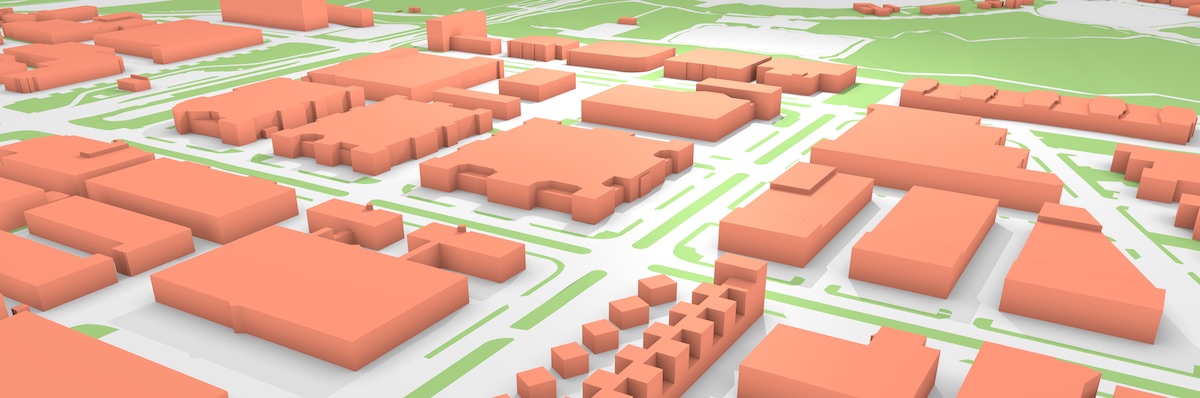
Building models (see the 3D webviewer)
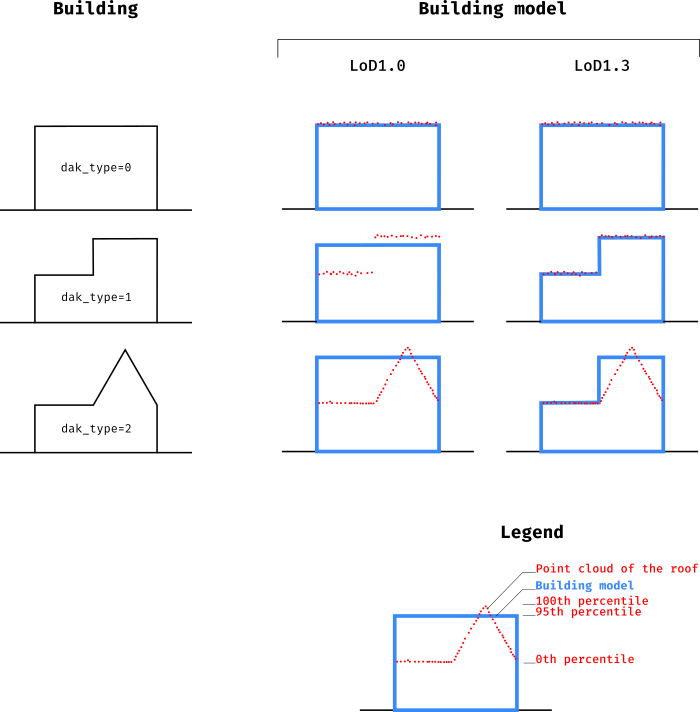
In the current noise simulation practice each building, regardless of its roof shape, is modelled with a single height level. The resulting block-shaped building representation is called LoD1. Modelling a building with only a single height can lead to large errors in the modelled height in case the building in reality consists of different parts that each have a very different height. Therefore, we have investigated how to automatically create building models in which multiple height levels are possible, i.e. using the LoD1.3 representation.
Terrain model
For v0.3 we experimented with a Triangulated Irregular Network (TIN) for representing the terrain. A TIN is like a blanket of triangles tightly fit to the ground, excluding above-ground objects (buildings, trees etc.). In flat areas the triangles are usually larger, in areas with high relief the triangles are usually smaller, in order to achieve a good fit to the ground surface.
For generating the triangulation we can choose the maximum allowed deviation from the true ground (as measured in the point cloud of AHN3). For the test data sets of v0.3, we choose respectively 0.3, 0.5, 1.0 meters of deviation. This means for example that the 0.3m TIN is guaranteed to be within 0.3 m of the true ground (as per AHN3). However, smaller errors mean more triangles and larger data sets, as you’ll see in the downloads.
The reason for choosing a TIN instead of 3D lines is to be able to generate more accurate data more efficently. However we realize at least two current challanges with TINs. Firstly, the common noise calculation softwares in the Netherlands read terrain data only as 3D lines, secondly, common GIS software does not have native support for file formats that can store TINs efficiently.
Therefore we provide the TINs also as 3D lines which in this case are the edges of the triangles, and provide the TINs in the common ESRI Shapefile and GeoPackage formats which are, although very inefficient for this purpose, understood by most GIS software.
Groundtypes with noise characteristcs
Also for modelling noise-reflection and -absorption values, we use the BGT as basis. Neighbouring polygons with same values have been aggregated, small areas have been eliminated and boundaries have been simplified.
BGT klasse en fysiekVoorkomen attribuutwaarde |
Akoestische classificatie |
|---|---|
| OndersteunendWaterdeel (alles) | absorberend |
| OnbegroeidTerreindeel (erf, gesloten verharding, open verharding, half verhard | reflecterend |
| OnbegroeidTerreindeel (onverhard, zand) | absorberend |
| BegroeidTerreindeel | absorberend |
| Pand (alles) | reflecterend |
| Scheiding (alles) | reflecterend |
| Kunstwerkdeel (alles) | reflecterend |
| OverigBouwwerk (alles) | reflecterend |
| Overbruggingsdeel (alles) | reflecterend |
| Wegdeel (anders dan ruiterpad en onverhard) | reflecterend |
| Wegdeel (ruiterpad, onverhard) | absorberend |
| OndersteunendWegdeel (verkeerseiland, gesloten verharding, open verharding, half verhard) | reflecterend |
| OndersteunendWegdeel (berm, onverhard, groenvoorziening) | absorberend |
| Waterdeel (alles) | reflecterend |
Downloads
The 0.3 test data is available as ESRI shape.
The following source data was used:
- BGT: date 11-02-2019. [download source data]
- BAG: date 25-12-2019. We removed the underground buildings and included some objects from BGT’s Overigbouwwerk layer. [download source data]
- AHN: version 3, download tiles from PDOK: 37ez2, 37fz1, 37gn2, 37hn1
For the sample area we prepared the following data sets.
Building data
| Feature | Explanation | File name | Download |
|---|---|---|---|
| building in LoD1. Same as in version 0.2 | Building footprints with a single height value per building. The height of the building model is computed as the 75th and 95th percentile of the points that are part of the roof. | <tile id>_lod10_<percentile> |
[ESRI Shapefile] |
| buildingd in LoD1.3 | Building footprints with a single height value per building-part. The height of the roofparts is computed as the 75th percentile of corresponding AHN3 elevation points. | lod13 |
[ESRI Shapefile] |
Terrain data
We offer the TIN in three different formats and three different simplifciation values, and the 3D lines only as Shapefiles, for using them in your prefferred GIS application. In our experience reading the Shapefiles is best performaning in ArcGIS, the GeoPackage in QGIS, the OBJ in Meshlab, Blender or FME.
The 3D lines are primariliy meant for importing into the noise calculation software. Because the size of the 3D lines files are big, we also provide them chopped into quarters, as tiles.
| Geometry | Format | Error threshold | |||||||||||
|---|---|---|---|---|---|---|---|---|---|---|---|---|---|
| 0,3m | 0,5m | 1,0m | |||||||||||
| TIN | ESRI Shapefile |
tin_03m.shp.zip |
tin_05m.shp.zip |
tin_1m.shp.zip |
|||||||||
| GeoPackage |
tin_03m.gpkg.zip |
tin_05m.gpkg.zip |
tin_1m.gpkg.zip |
||||||||||
| Wavefront OBJ |
tin_03m.obj.zip |
tin_05m.obj.zip |
tin_1m.obj.zip |
||||||||||
| 3D Lines | ESRI Shapefile |
lines_03m.zip |
lines_05m.zip |
lines_1m.zip |
|||||||||
| ESRI Shapefile |
lines_03m_tiles.zip |
lines_05m_tiles.zip |
lines_1m_tiles.zip |
||||||||||
Ground type data
The ground type data (bodemvlakken) is offered in three versions, 6 m2, 12 m2 and 18 m2. For instance in the 6 m2 version, the objects which area is less than 6 square meters are merged into their lagest neighbor, taking the ground property of their neighbor.
| Format | Minimum object area | ||
|---|---|---|---|
| 6 m2 | 12 m2 | 18 m2 | |
| ESRI Shapefile |
tiles_bodemvlakken_6.shp.zip |
tiles_bodemvlakken_12.shp.zip |
tiles_bodemvlakken_18.shp.zip |
| GeoPackage |
tiles_bodemvlakken_6.gpkg.zip |
tiles_bodemvlakken_12.gpkg.zip |
tiles_bodemvlakken_18.gpkg.zip |
Attributes
The table below describes the attributes of the buildings and ground types data sets. The lines in the terrain data set do not have attributes.
| Feature | Attribute | Explanation |
|---|---|---|
| building | bag_id | the identificatie attribute from the BAG |
| dak_type | type of the roof of building2 – roof with at least one slanted surface1 – roof with multiple, only horizontal surfaces0 – roof with a single horizontal surface-1 – no AHN point was found for the building-2 – could not detect a roof surface, even though AHN points were found
|
|
| rmse | Root mean square error between reconstructed LoD1.3 model and AHN3 points. | |
| h_dak | roof height or absolute height of the roofpart (height measure from NAP) | |
| h_maaiveld | maaiveld hoogte or absolute ground height of the building | |
| is_complex | `1` if this is a complex building, meaning that not all the detected rooflines were used in the reconstruction process in order to limit processing times. | |
| ahn_geldig | or valid height1 – building was built before the point cloud was collected for the tile0 – building was built after the point cloud was collected for the area
|
|
| ahn_datum | the date of the acquisition of the point cloud for the tile | |
| ground type | uuid | unique ID of the object |
| bodemfactor | sound reflectance property of the ground0 – reflecting1 – non-reflecting
|
|
| terrain | - | - |
Feedback Form
In case of questions or comments about the data please fill out our feedback form.
Disclaimer
The 3D noise data version 0.3 is only made available for testing purposes. No rights can be obtained from the data. None of the parties involved can be hold responsible for damage that is caused by using the data.
Project partners