Changes in the inflow conditions can largely impact flow and dispersion patterns in atmospheric boundary layer (ABL) simulations. The variability in the inflow conditions is a major aleatory uncertainty when predicting flows in the atmosphere, which can not be removed from the problem, and thus should be assessed adequately. To quantify the effect of inflow uncertainty on the simulation results we apply an approach based on three steps: 1) characterize the uncertain inflow parameters, i.e. the ABL roughness height, and the wind magnitude and direction, using either field experiment or mesoscale simulation data; 2) propagate inflow uncertainties to the Quantities of Interest (QoI) using a polynomial chaos expansion approach, which requires a finite set of Reynolds-averaged Navier-Stokes (RANS) simulations to construct response surfaces for the QoI; and 3) sample the resulting response surfaces to determine the 95% confidence intervals for the results. Additional details from this research can be found in articles 1, 5 and 6 from the publications section.
In urban environments
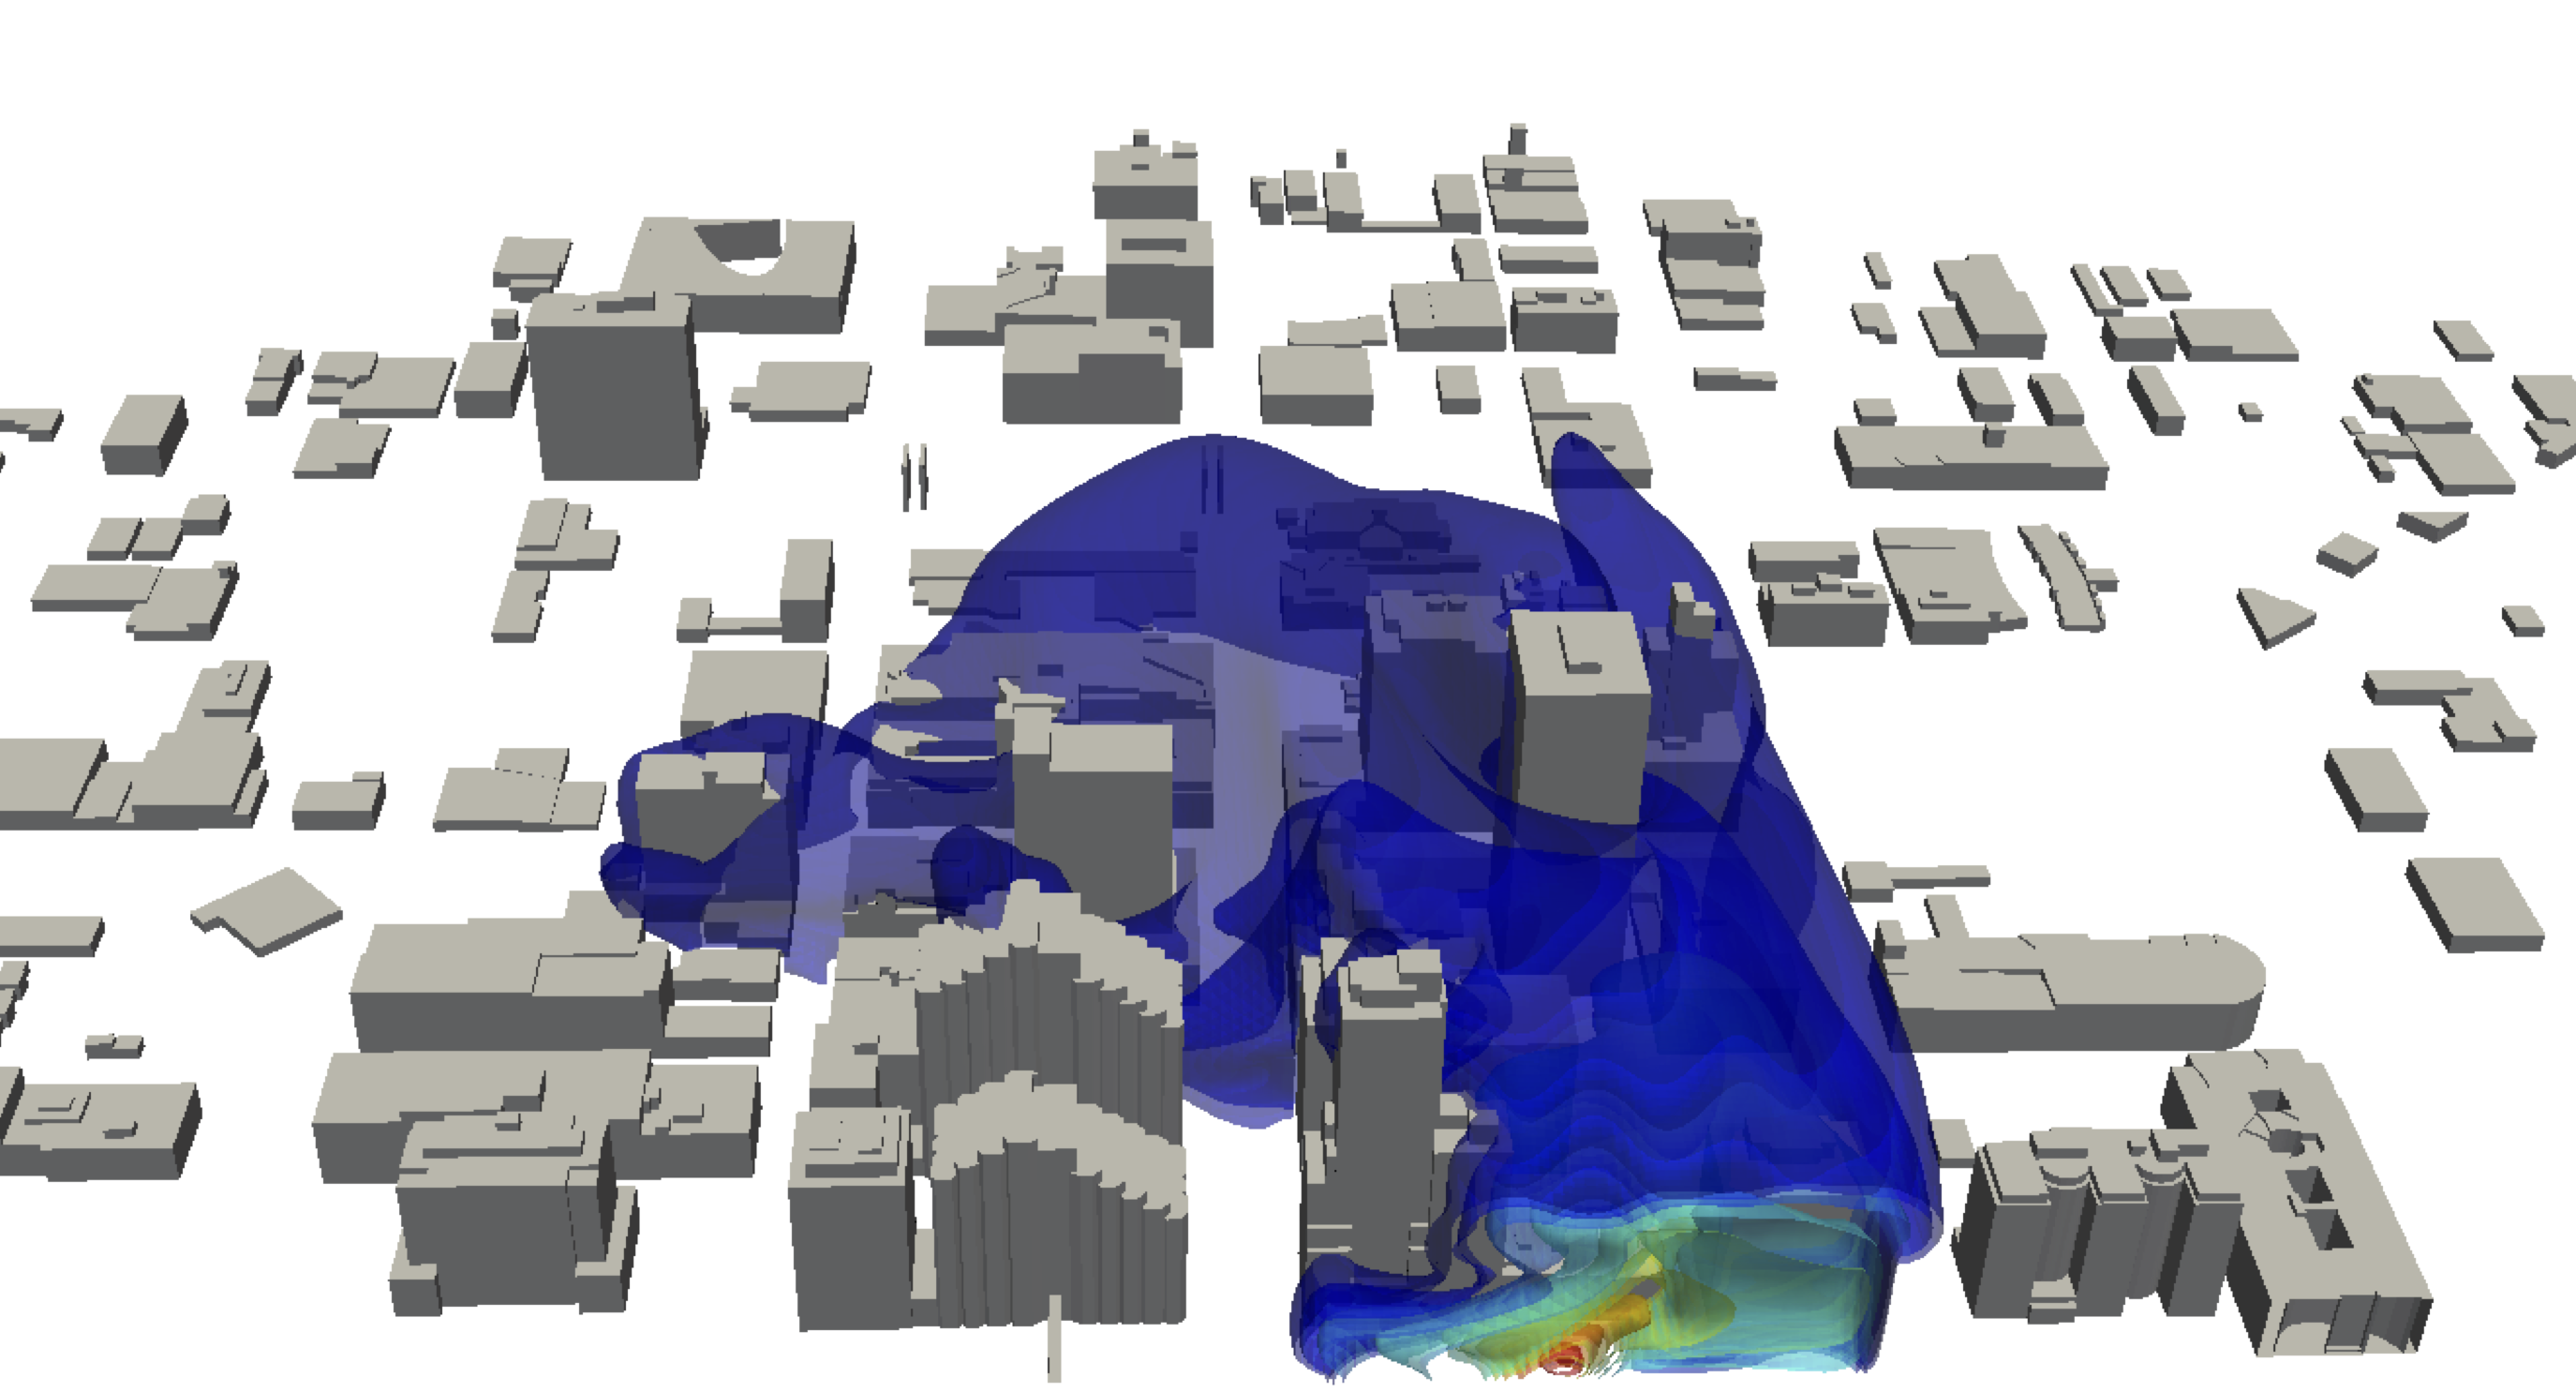
We applied the uncertainty quantification framework to predict wind flows and dispersion over Oklahoma City. To perform the simulations we used the open source tool OpenFOAM, which allows us to introduce dispersion by resolving an additional scalar transport equation for pollutant concentration. The pollutant release takes place at the location marked in the experimental data used to validate the results.
To characterize the uncertain inflow parameters we used experimental data available at the inflow location, by extracting time series from the south-most station available from the experimental data. The results confirms that the variability in the inflow conditions is an important contributor to uncertainty in the prediction of the mean flow in the urban canopy.
The UQ study allows to indicate locations in the flow that are particularly sensitive to the inflow conditions, such as the regions near P3 and P7. The comparison with the experimental data in the figure also identifies stations where there remains a discrepancy with the CFD results that is most likely induced by additional uncertainties. Probable candidates are geometric uncertainties, or the epistemic uncertainty related to the limited accuracy of the turbulence model when computing the complex bluff body flow inside the urban canopy.
In open field terrains
Similarly to our study over Oklahoma City, we applied the uncertainty framework to the renown Askervein hill case. To perform the simulations we used the open source tool openfoam, while the uncertainty process was completed thanks to the Dakota software, from Sandia labs.
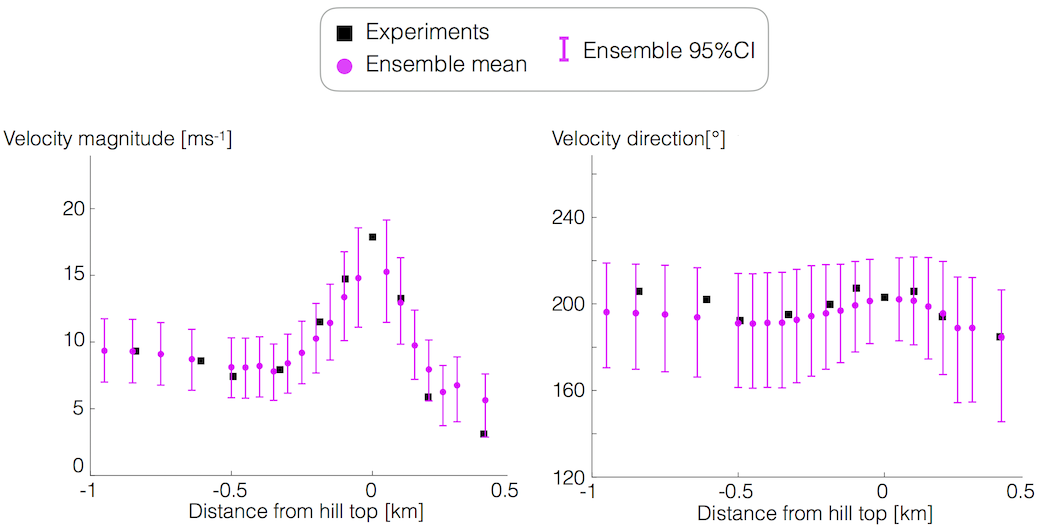
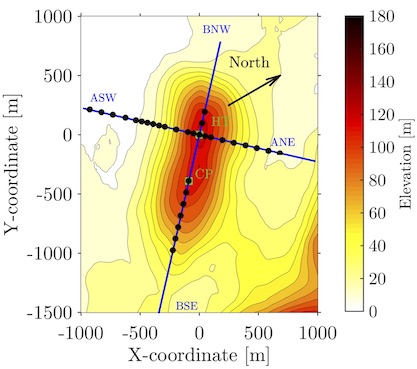 The results are compared for velocity magnitude and direction over the line ASW-ANE. In this case to characterize the uncertain inflow parameters we used results from the mesoscale code WRF, by perturbing time series at the inflow location within Askervein hill. The results shows that the variability in the inflow conditions contributes to uncertainty in the prediction of the mean flow in open field terrain simulations.
In this case to characterize the uncertain inflow parameters we used results from the mesoscale code WRF, by perturbing time series at the inflow location within Askervein hill. The results shows that the variability in the inflow conditions contributes to uncertainty in the prediction of the mean flow in open field terrain simulations. The UQ result was obtained by drawing 1.000 realizations from the probability density function obtained from the ensemble of mesoscale simulations. The plot shows that the experimental mean wind velocity and direction value during TU03a is encompassed by the 95% confidence intervals predicted by the UQ study at all points along line ASW-ANE. In addition, the confidence intervals reveal variations in the impact of the inflow uncertainties at different locations along the hill. For the velocity magnitude, the intervals are largest closest to the hill top, and smallest right after the maximum height, in the recirculation area. Instead, for the wind direction the intervals narrow near the hill top, indicating that the flow direction in this region is dominated by the hill’s geometry.