Labs about NDVI
This is just a formative labs, there is no marks attached to it and it won’t be marked.
It’s a good idea to do it to get used to the data and to practise methods that will be useful for the hw02
Overview
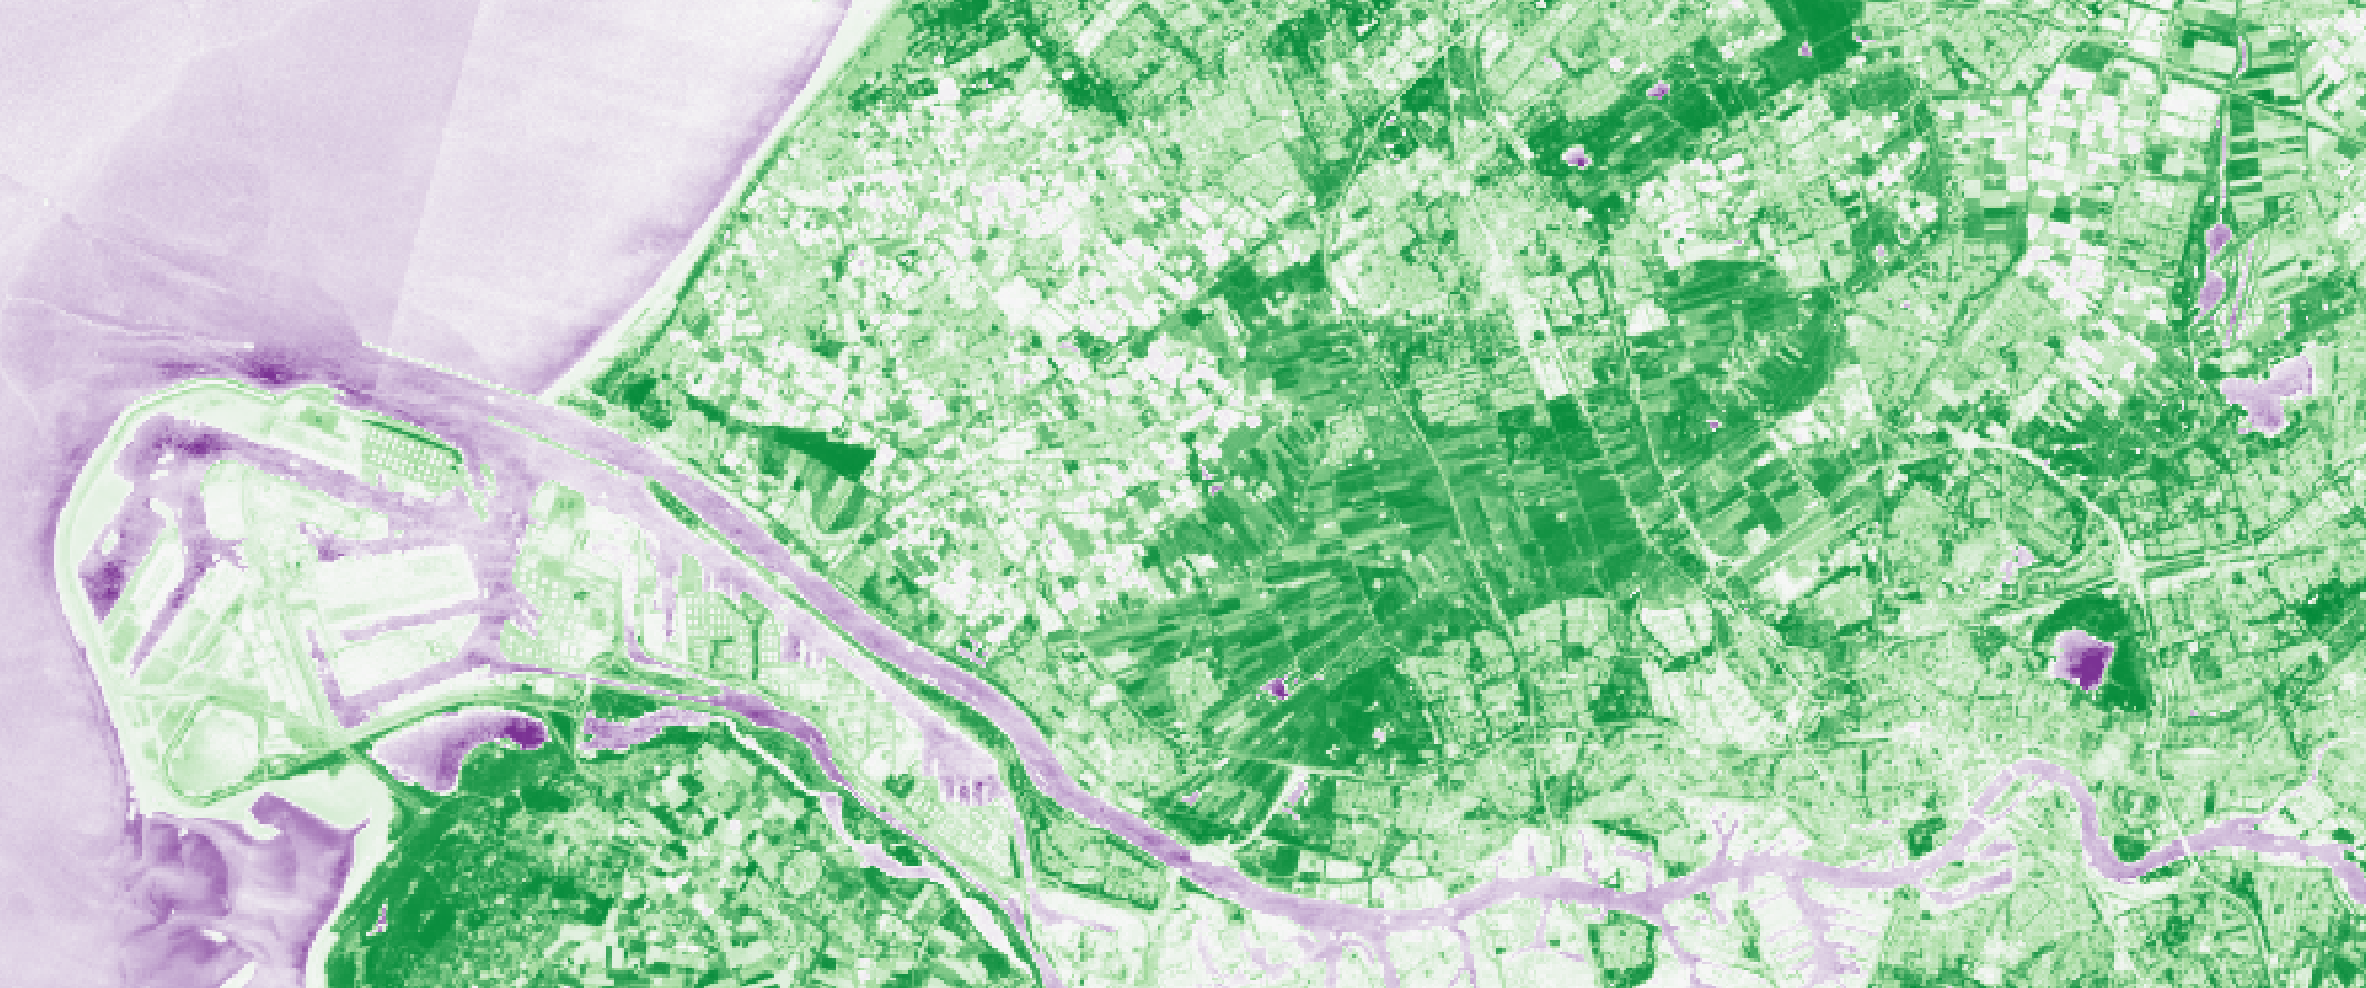
The aim of this lab is to calculate the normalized difference vegetation index (NDVI) for one Sentinel-2 image for the area around Delft.
The Sentinel-2 dataset
Downloading Sentinel-2 datasets is free and… not so easy. The official website can be used, but there are also services that offer a better experience.
To make everything easy, for this lab I downloaded one dataset (mostly cloud-free) for the region of Delft (date was 2020-05-30).
S2A_MSIL2A_20200530T105031_N0214_R051_T31UET_20200530T134211.zip
The images (each band is one image) have been geometrically corrected and are geo-referenced.
The folder is rather big, and the images can be found in /IMG_DATA in 3 different resolutions: 10m, 20m, and 60m.
One file, eg /R20m/T31UET_20200530T105031_B03_20m.jp2, has a resolution of 20m and it’s the band=3 (_B03_).
To know what that band is, you can check on the Sentinel-2 website, in the metadata, or perhaps easier, on the Wikipedia page.
The easy way with QGIS
To calculate the NDVI, we need 2 bands: visible red & near infra-red (NIR); and it’s a simple formula:

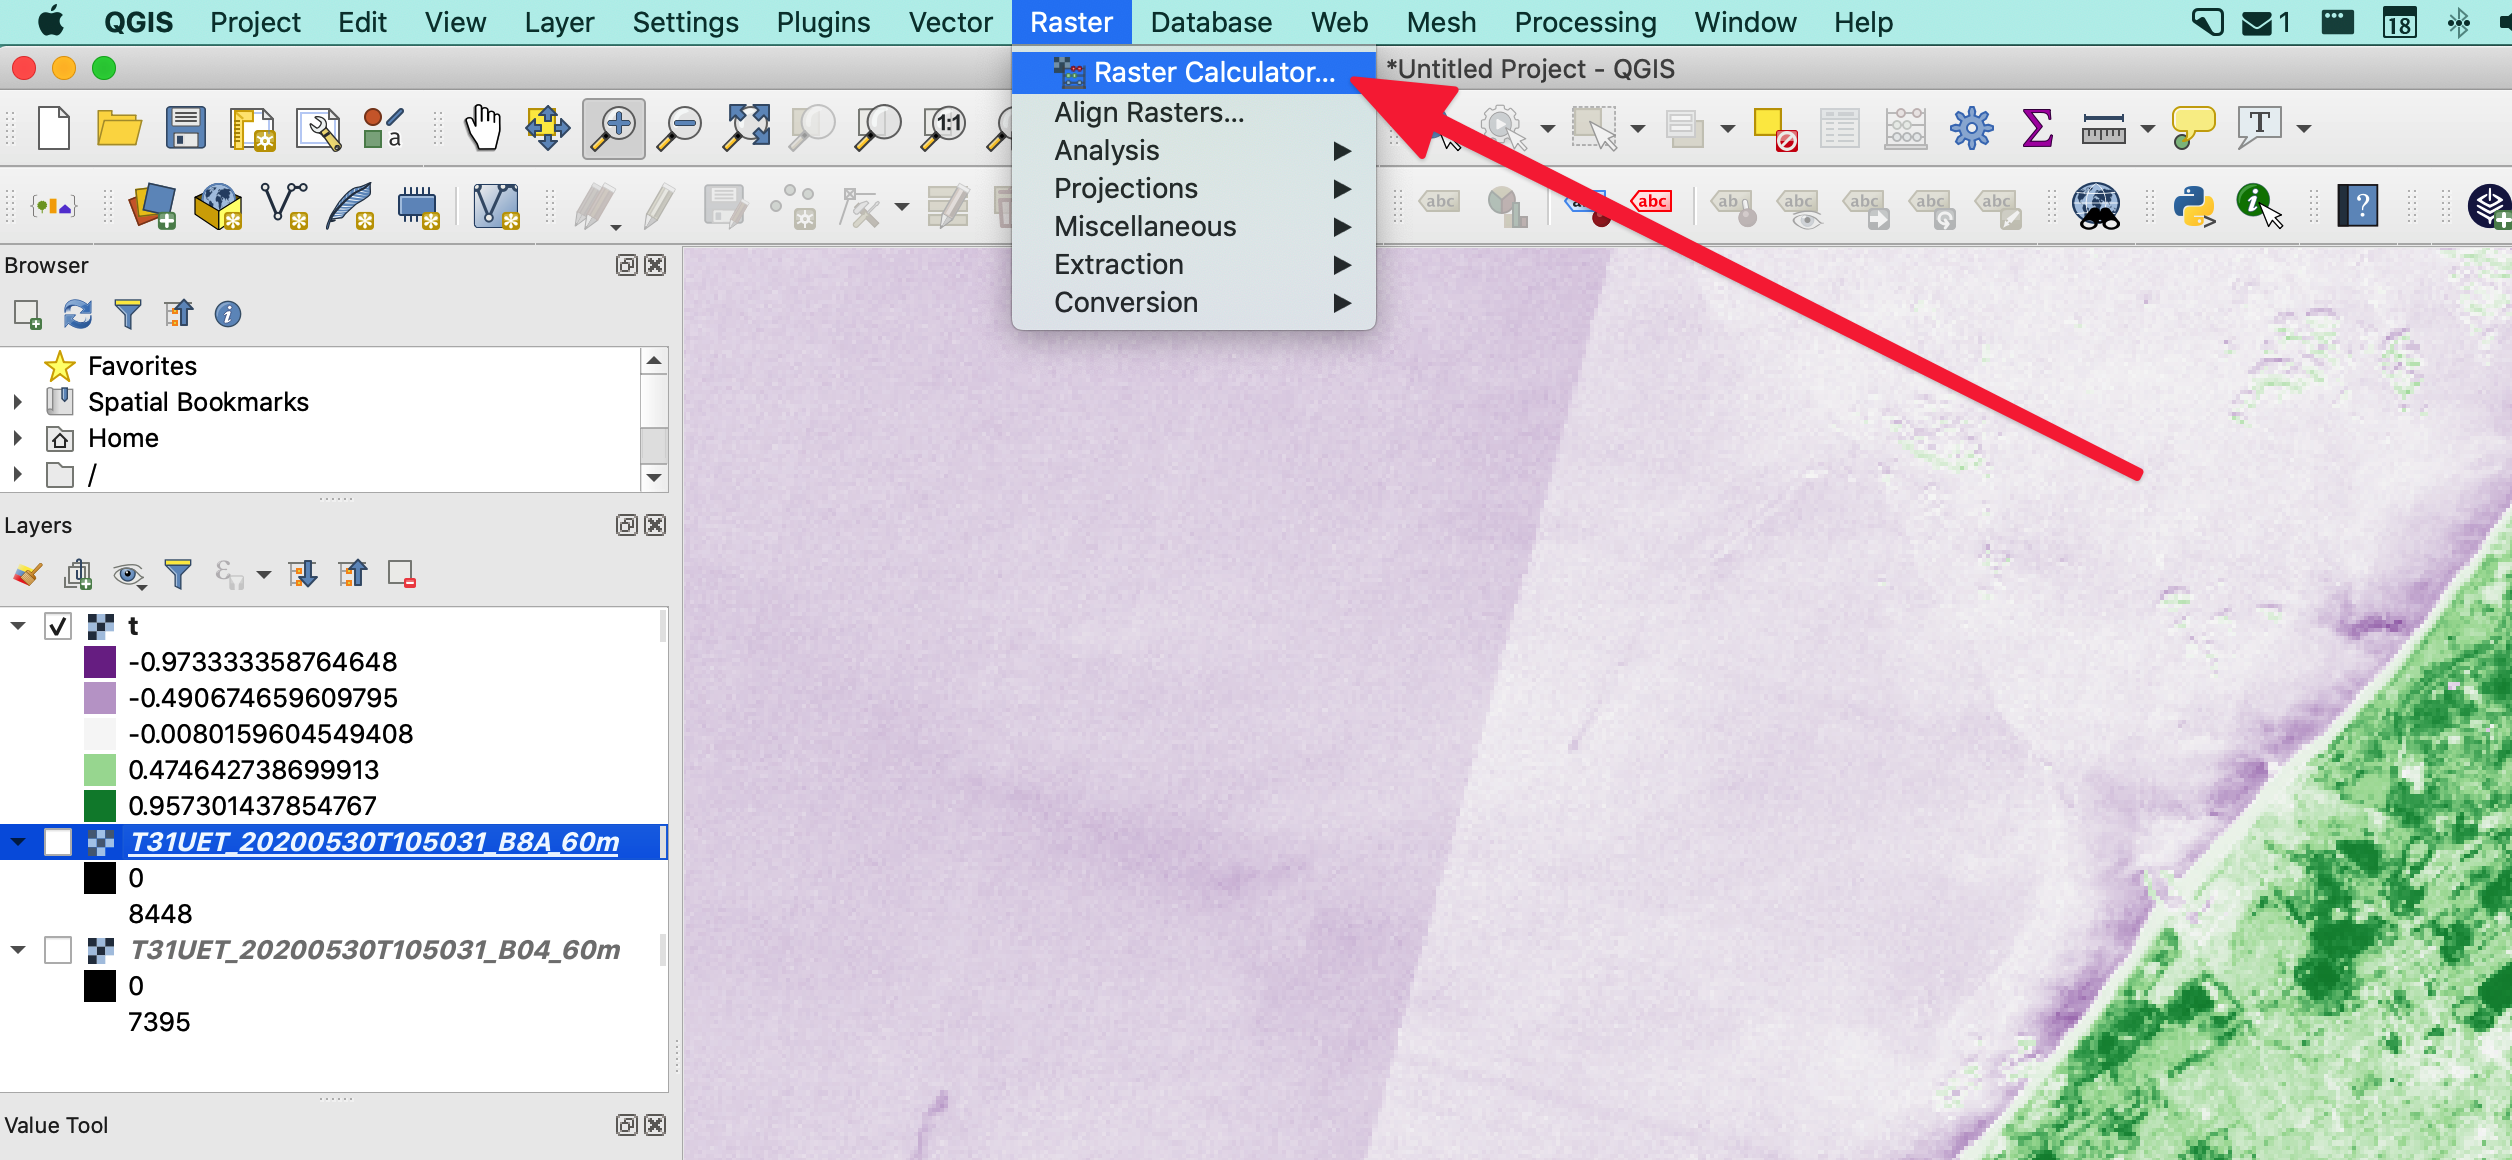
So here it suffices to open the 2 needed bands in QGIS and use the Raster Calculator (which uses map algebra, as you’ve learned in GEO1002) and voilà you should obtain a new layer with values ranging from -1 to +1 (similar to the header image of this page).
You can verify that for the Delftse Hout (the “forest” east of Delft) the values are high for where the forest is, and low for where the lake is.
(this part was more or less take from that YouTube video, which gives more details if necessary)
The (better) way with Python
It’s obviously possible to do the same with Python code. The main library to use is rasterio, which should be installed (instructions); other libraries can be used, I just think this is a good one.
One installed, you should have installed somewhere (under macOS/linux it’s in your path, under Windows please those who use it let us know) the program rio, so you can for instance do:
$ rio stack band_3.jp2 band_4.jp2 -o stacked.tif
to create a new file stacked.tif (a GeoTIFF) containing the bands in the 2 others files.
It’s also possible to crop, reproject, convert, etc. datasets in a simple way.
You can also use rasterio to read, modify, and write files.
This is what you should try to here: read the necessary input Sentinel-2 (as above) and output the same file as you created with QGIS.
You could create one file with rio stack as above, or read each band one by one, it’s up to you.
I also suggest your crop the file to test with a smaller file (using the whole dataset can be slow), this can be done manually in QGIS or with rio crop.
To perform the task, you will need to load the values of each of the bands into an array, in this case by far the easiest and fastest is to use numpy (this is a library that you will be using a lot the coming months in different courses, so it’s worth spending time learning it).
(this is a jupyter notebook, to mix Python code with text and run the whole code in a web-browser, I’ll explain in one session.)
[last updated: 2020-09-15 14:37]